グラフィック上での日本語を正しく扱うための注意事項(2010年5月19日再掲)
●グラフィックデバイスによって異なる。
postscript()やpdf()の場合
中間さんのAI_UCS2.Rをsource()を使うなどして先に実行してからグラフィックデバイスを開き,par(family="Japan1GothicBBB")をしてグラフ出力すべき。はしご高のように,UTF-8では表示できるがEUC-JPでは表示できないような文字も表示できるようになる(参考:2008年6月23日のメモにいただいたコメント)。
●描画が終わったらdev.off()を忘れずに。
win.metafile()の場合
windowsFonts(JP1=windowsFont("MS Gothic"), JP2=windowsFont("MS Mincho"), JP3=windowsFont("Meiryo"))
par(family="JP3")
を実行してからplot()などのグラフ出力を実行すべき。こうしておけば,拡張メタファイル(emf)をPowerPointやOpenOffice.orgのImpressなどに読み込んでから編集するためにオブジェクト変換しても漢字が文字化けしない。
●描画が終わったらdev.off()を忘れずに。
日本語をベクトルグラフィックとしてプロット(注:歴史的意味しかない技)
●RにはHersheyEUCとして約700の日本語フォントが含まれていて,text関数から使えるのだが,フォントの指定が面倒なので使いにくかった。これを簡単に使えるようにする関数jtext(実行例を含むソース)を書いてみた。ただし内部で漢字文字列をJISコード番号文字列に変換するPerlプログラムjiscode.plを呼び出していて,その中でcgiなどで良く使われているjcode.pl(注:リンク先のWikipediaの説明にあるように、既に使うべきではない。Jcode.pmのページでも書かれているように、2022年現在のPerlではEncode.pmを使うべき)を呼び出しているので,それらが実行時に呼び出せるディレクトリに置かれていて,かつActive Perlにパスが通っている必要がある。もっとも,LinuxやFreeBSD環境ならばjiscode.plの先頭にPerlのパスを書けばいいはずである。なお,Perl5.8以降では標準のEncodeライブラリを使う方がスマートな気がするし,それ以上に,単にjisx0208にできればいいのだからCで書いてライブラリ化した方が便利だと思うが,とりあえずPerlで用が足りるので今後の課題ということにする。
実行例を下に示す(上でリンクしているRプログラムを実行してできるpngファイル)。
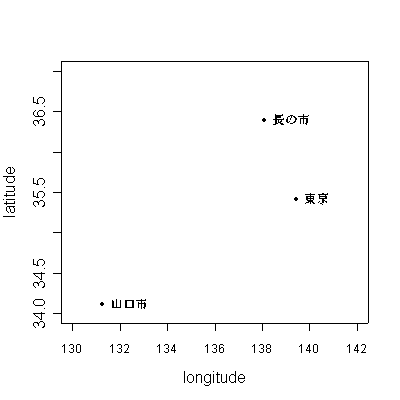
●なお,pLaTeXと組み合わせて使えば,上のような面倒なことをしなくても,日本語を含むプロットが簡単にできる(ベクトルグラフィックとしてではなく,文字としてのプロットになる)。textで普通に日本語文字列をプロットした後で,dev.copy(pictex,"jtext3.tex"); dev.off()としてpictex形式のファイルjtext3.texを作り,これを
\documentclass{jarticle}
\usepackage{pictex}
\usepackage[dvipdfm]{graphicx}
\begin{document}
\begin{figure}[h]
  \centerline{\input{jtext3.tex}}
  \caption{3都市の緯度と経度の2次元表示}
\end{figure}
\end{document}
のようにして読み込むファイルtest.texを作って,platex test,dvipdfm testとすれば,test.pdf (16,518 bytes)ができあがる。こちらの方が使えるフォントが多いし,美しくて実用的である(時折そのままでは通らない文字があるのだが,出力されるpictexファイルを直接エディタで編集すれば問題ない。textだけではなく,xlabとかmainでも日本語が使えた)。
群ごとにマークを変えたプロット
●簡単にやるには,plot関数のpch=に値を与えればよい。例えば,X,Y,Zという3つの村があって,それぞれ身長と体重のデータがあって,その関係を村ごとにマークを変えてプロットしたいとする。
●データは1行目がタブ区切り変数名で2行目以降がタブ区切りデータのテキストファイルからread.delim関数で読む(上述)のが普通だが,プログラム内で与えるには,
hx <- c(161.5, 167.0, 157.5, 160.5, 156.0, 165.0, 157.5, 169.5, 168.5, 178.5)
wx <- c(49.2, 72.8, 61.6, 62.6, 73.6, 57.8, 60.8, 92.4, 58.2, 71.8)
hy <- c(159.5, 161.5, 148.0, 164.0, 169.5, 164.5, 161.0, 172.0, 168.0, 163.0, 153.5, 165.5,
        168.0, 161.0, 160.5, 158.0, 156.0, 155.5)
wy <- c(43.6, 65.2, 49.6, 57.4, 67.0, 61.4, 56.2, 66.4, 67.0, 60.2, 44.6, 63.2, 62.4, 53.8,
        63.6, 59.0, 59.0, 53.6)
hz <- c(171.5, 176.5, 166.0, 175.0, 166.0, 169.0, 175.5, 167.0, 163.5)
wz <- c(73.2, 77.8, 58.0, 57.2, 67.0, 73.6, 97.8, 63.0, 67.4)
として村ごとのデータを与え,さらに
x <- data.frame( VG=c(rep('X',NROW(hx)),rep('Y',NROW(hy)),rep('Z',NROW(hz))),
 HEIGHT=c(hx,hy,hz), WEIGHT=c(wx,wy,wz) )
としてデータフレームにすればよい。
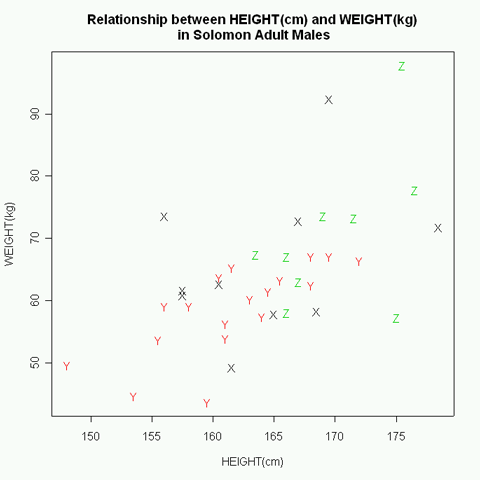
●村名をそれぞれ違う色で身長と体重の座標位置にプロットするには,
plot(x$WEIGHT ~ x$HEIGHT, pch=as.character(x$VG), col=as.single(x$VG),
 main="Relationship between HEIGHT(cm) and WEIGHT(kg)\n in Solomon Adult Males",
 xlab="HEIGHT(cm)",ylab="WEIGHT(kg)")
とすればよい。下図が得られる。なお,村ごとに細かく指定したい場合は,
plot(x$WEIGHT[x$VG=='X'] ~ x$HEIGHT[x$VG=='X'], pch='X', col="blue",
 xlim=c(140,180), ylim=c(40,100))
などとしてから,points関数を使って重ね書きすればよい。なお,この例のようにプログラム内で付値したのであれば下記のようにする。
plot(hx, wx, pch='X', col="blue", xlim=c(140,180), ylim=c(40,100))
points(hy, wy, pch='Y', col="red"); points(hz, wz, pch='Z', col="green")
●もっとも,3種類くらいならいいが,120種類のマークを変えるのは難しい。マークとして使えるのは1文字だけなので,アルファベットや数字では不足してしまう。解決策は3つあって,
- 色とマークを組み合わせる: pchに与える値として,1から25まではプロットとして適切なマークが既に定義されている(26から32は空白で,33以上は文字や記号)ので,col="red"とかcol="blue"とか指定して(または剰余を使うなどして周期的変数を生成して)色を変えれば120くらいは何とかなりそうである。欠点は,モノクロプリンタに印字すると色の区別がつかないことである。
- text( )関数を使って文字列を重ね打ちする: plot(x,y)の後に(たぶんpch='.'とかpch=20とかで小さい点にしておいた方がいいと思う),text(x, y, paste(string), pos=4, offset=0.5)などとすれば,stringを(x,y)の点の右側に印字してくれる。(plotでlog="x"により横軸を対数軸にしておいても,text( )による文字追加は自動追従してくれる)。この場合文字を小さくしておきたいので,予めpar(ps=6)などとしておく。それでも重なる場合はあると思う。(注:「日本語をベクトルグラフィックとしてプロット」の項に書いたように,文字列をベクトルグラフィックとしてプロットすることもできる)
- identify( )関数を使う: すべてのデータ点を特定する必要はないので,必要な点についてだけ情報を表示できるのがベストであろう。plot(x,y)の後にidentify(x,y,labels=string)としておくと,プロットの後に十字型のマウスカーソルが出現するので,画面のstringを表示したい点の上でクリックすればstringが出現する。描画ウィンドウのメニューのstopからか,右クリックメニューからstopするまで,複数の点をクリックできる。
度数ゼロを含む度数分布図を描く
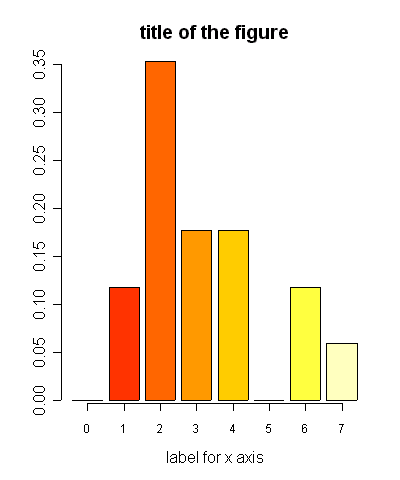
●連続した自然数をカテゴリとする度数分布を描きたいけれども,度数がゼロのカテゴリを飛ばしたくない場合がある。例えば,子ども数の分布を描きたいときは,たまたま子ども数7人の母親がいなかったとしても,8人の人がいたら,子ども数7人の母親の度数がゼロであることも,図には表したいだろう。とくに,複数の図を比較する場合は尚更である。ところが,普通に子ども数を代入(付値)した変数をxとすると,barplot(table(x))では,度数がゼロのカテゴリがtableの出力に出てこないので描画されないのである。この解決のために汎用の関数を作ってみたので紹介する。
●関数定義は以下の通り。
sbarplot <- function(freq,xnames,xlabel,title) {
maxc <- max(as.single(dimnames(freq)[[1]]))
z <- rep(0, NROW(xnames))
for (i in c(1:NROW(freq))) {
z[as.single(dimnames(freq)[[1]][i])+1] <- freq[[i]]/sum(freq) }
barplot(z, names.arg=xnames, main=title, xlab=xlabel)}●使い方は,上の関数をRに読み込んだ後で,例えば,y <- c(3,4,2,1,3,4,2,2,3,2,1,2,6,6,7,4,2)というデータがあったときに,0や5も含めた度数分布図を書きたければ,x <- c(0:7)として横軸を定義しておいて,sbarplot(table(y),x,"label for x axis","title of the figure")とするだけで,下図が得られる(なお,解像度を指定してpngファイルを作るには,画面にグラフが描かれている状態で,例えば,dev.copy(png,"sample.png",width=400,height=480); dev.off()とすれば,画面に出ているグラフがsample.pngというファイルに保存される)。縦軸を割合でなくて実数にしたい場合は,sbarplot関数の中から/sum(freq)を削除すればよい。
●forなど使っていてR的ではないコードだし,おそらくもっと簡単な方法があると思うので,改善のご意見がいただければ幸いである。
●群馬大学の青木先生からいただいた2通りの関数(実行の仕方を含む)を掲載する。
x <- c(162, 159, 163, 157, 152, 168, 153, 156, 167, 161, 154, 162,
 160, 157, 169, 160, 162, 158, 161, 160, 163, 160, 163, 153, 164, 163, 163, 153,
 155, 155, 162, 163, 168, 160, 158, 168, 163, 163, 158, 153, 161, 153, 168, 156,
 155, 159, 158, 161, 157, 155, 161, 156, 167, 156, 158, 152, 160, 160, 155, 157,
 158, 160, 157, 156, 164, 157, 161, 158, 161, 153, 163, 161, 160, 162, 159, 162,
 161, 158, 160, 177)
としてから試されたい。
- mbarplot.R。使い方はxをデータベクトルとして,mbarplot(x,5)とすれば階級幅5の度数分布が計算され,同時にグラフが描かれる。
- dosuubunpu.R。使い方は同じくxをデータベクトルとして,dosuu.bunpu(x,2.5)とすれば階級幅2.5の度数分布が計算され,同時にグラフが描かれる。
◎この項,長らく放置していたが,裏RjpWikiさんの記事を見て目からウロコが落ちた。なるほど,tableをとる前にfactor化してlevelsを強制指定すれば,それだけで良かったのだな。つまり,上述のyについて0と5も含んだ度数分布図を描くためには,
barplot(table(factor(y, levels=0:7)))
とすれば良かった。
人口ピラミッドを作る(2014年9月4日 ver 1.4)
- ■pyramid()関数の開発
- ●かつては,軸を書かせないでbarplotしてからaxis関数でカスタマイズした軸を出力するなど,いろいろなテクニックを使って作っていたが,関数内でpar()を操作して画面を2分割して描画するなど不自然であり,間に合わせとしか言いようのない関数であった。当時の関数はpyramid.Rとして残しておく。当時の描画例も下に残しておく。
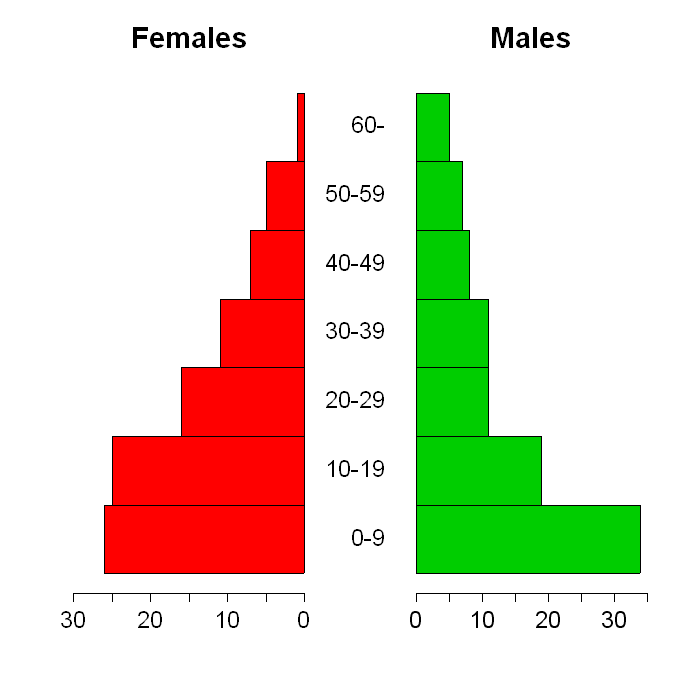
- ◆なお,人口学のページで紹介している人口ピラミッドの作り方は,まだこの旧バージョンによる説明が残っているが,下記の新しいバージョンでも試してみたので参照されたい。年齢階級数が多い場合は,まだ微調整が必要かもしれない。
- ●その後数年が経つうちに,低レベル関数の扱いに慣れてきたし,レーダーチャートを作る関数なども作ってみたりしたので,自分で長方形の座標を計算して描画するように全面的に書きかえることにした。ちまちまと計算式を書いただけなので,何も難しいことはしていないし,じっくりソースを読めば誰でもわかるコードだと思う。ポイントは,最初に何も描画せずに左下が(-1.1-Cgap/2,-0.1),右上が(1.1+Cgap/2,1.1)となる架空座標系を設定した上で,ラベルや軸要素は最初から架空座標系で描き,データは架空座標系に変換してプロットさせている点である。たぶんまだ改良の余地があると思うが,とりあえず以前のバージョンより使いものになると思う。
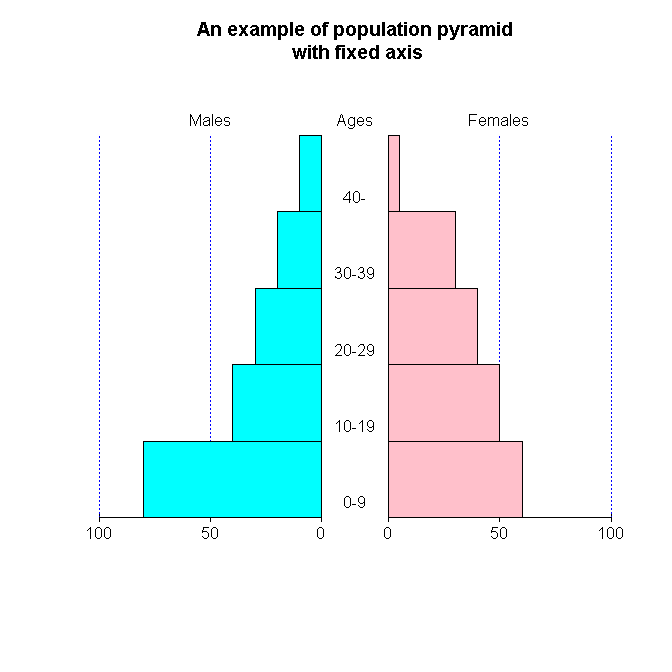
- ●圧縮したファイルは,pyramid_1.1.zip(rev 1.1; 13,031 bytes),またはpyramid_1.1.tar.gz (rev 1.1; 3,513 bytes)なので,ダウンロードしてからパッケージインストールして,library(pyramid)とすれば,pyramid()とpyramids()が使えるようになる。example(pyramids)で描ける図を下に示す。
- ■パッケージ化
- ●Windows XP環境での作業を書いておくが,LinuxやFreeBSDでも大差ないであろう。なお,ここではRの標準関数を組み合わせて作った関数について説明するが,srcサブディレクトリとinstサブディレクトリを作ってCやC++やFORTRANで書いた外部プログラムを組み合わせることも可能である。
- ●まず,パッケージ用に適当なディレクトリを用意する。仮に,"d:\work\pyramid"としよう。ここに,テキストファイルDESCRIPTIONを用意する。DESCRIPTIONファイルは,例えば次のような内容にする(継続行は行頭を空白文字またはタブコードにすることに注意)。
Package: pyramid
Version: 1.1
Date: 2010/1/6
Title: Functions to draw population pyramid
Author: Minato Nakazawa <minato-nakazawa@umin.net>
Maintainer: Minato Nakazawa <minato-nakazawa@umin.net>
Depends: R (>= 2.2.0)
Description: Drawing population pyramid using (1) data.frame or (2) vectors.
	 The former is named as pyramid() and the latter pyramids(), as lapper
	 function of pyramid().
License: GPL (>= 2)
URL: https://minato.sip21c.org/swtips/R.html#PYRAMID
- ○次に,"d:\work\pyramid\R"と"d:\work\pyramid\man"という2つのサブディレクトリを作る。Rサブディレクトリには,このパッケージに入れたい関数のコードをファイルとして置く。拡張子は.Rとすることが推奨されている。ファイル名の先頭はアルファベットでなければいけない。ここでは関数定義部分だけをpyramid.Rとして置く。
- ○実行例はmanサブディレクトリに入れるドキュメントファイル(拡張子は.Rdにすることが推奨されている)に含める。ドキュメントファイルは英文できちんと書かねばならないので面倒である(マークアップ言語はTeX風に\で始まっているのでとっつきやすいが)。例えば,pyramid.Rdは次のようになる(manのファイルは関数単位で用意する--そうしないとexample(pyramids)ができない--ので,pyramids.Rdも作る)。
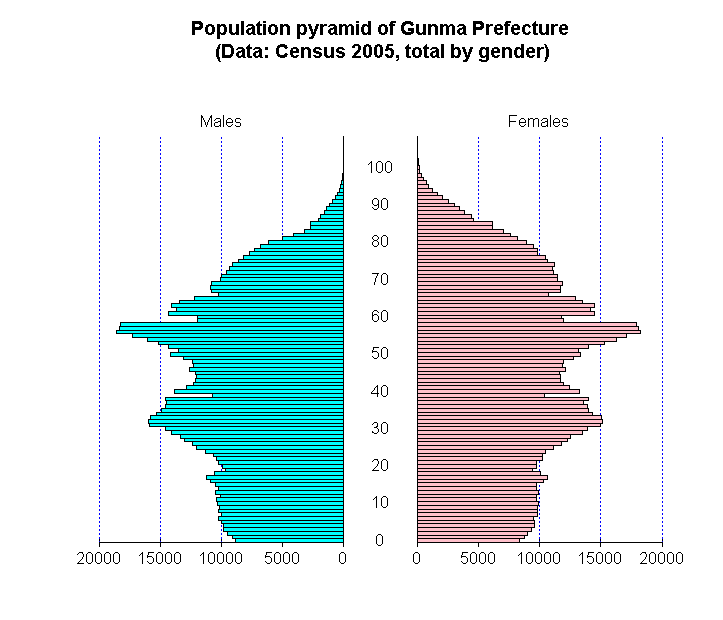
\name{pyramid} \alias{pyramid} \title{Drawing population pyramid using data.frame} \description{ Drawing population pyramid using data.frame. Detailed explanation is given in Japanese at https://minato.sip21c.org/swtips/R.html#PYRAMID. } \usage{ pyramid(data, Laxis=NULL, Raxis=NULL, Cgap=0.3, Cstep=1, Llab="Males", Rlab="Females", Clab="Ages", GL=TRUE, Cadj=-0.03 Lcol="Cyan", Rcol="Pink", Ldens=-1, Rdens=-1, main="", ...) } \arguments{ \item{data}{A data.frame including left pyramid numbers in the 1st column and and right pyramid numbers in the 2nd column, where the numbers of males in each age-class are usually given to left numbers and those of females are to right numbers. If the data.frame includes 3rd column, it is used as age-class labels, otherwise the row.names(data) is used as age-class labels.} \item{Laxis}{A vector of axis for left pyramid. If missing, automatically given.} \item{Raxis}{A vector of axis for right pyramid. If missing, Laxis is used.} \item{Cgap}{The width of center gap (as ratio to each panel) to draw age-class. Default is 0.3} \item{Cstep}{The interval to write the labels of age classes. Default is 1} \item{Cadj}{The vertical adjustment factor for the labels of age classes. Default is -0.03} \item{Llab}{The label of the left pyramid. Default is "Males".} \item{Rlab}{The label of the right pyramid. Default is "Females".} \item{Clab}{The label of the center age-class. Default is "Ages".} \item{GL}{Logical value to draw the vertical dotted lines. Default is TRUE.} \item{Lcol}{The color of the left pyramid. Default is "Cyan".} \item{Ldens}{The density of hatching lines (/inch) for left pyramid. Default is -1, when the pyramid will be filled.} \item{Rcol}{The color of the right pyramid. Default is "Pink".} \item{Rdens}{The density of hatching lines (/inch) for right pyramid. Default is -1, when the pyramid will be filled.} \item{main}{The main title of the pyramid.} \item{...}{Other options.} } \author{Minato Nakazawa \email{minatonakazawa@gmail.com} \url{https://minato.sip21c.org/}} \examples{ ages <- c('0-9', '10-19', '20-29', '30-39', '40-49', '50-59', '60-') males <- c(34, 19, 11, 11, 8, 7, 5) females <- c(26, 25, 16, 11, 7, 5, 1) data <- data.frame(males, females, ages) pyramid(data) # another example py.Males <- c(80, 40, 30, 20, 10) names(py.Males) <- c('0-9', '10-19', '20-29', '30-39', '40-') py.Females <- c(60, 50, 40, 30, 5) names(py.Females) <- names(py.Males) py.df <- data.frame(py.Females,py.Males) pyramid(py.df, Llab="Females", Rlab="Males", Lcol="navy", Ldens=5, Rcol="red", Rdens=10, GL=FALSE, main="An example of population pyramid\n with auto-axis") # The census 2005 for Gunma prefecture data obtained from # https://www.e-stat.go.jp/stat-search/files?page=1&layout=datalist&toukei=00200521&bunya_l=02&tstat=000001007251&cycle=0&tclass1=000001007252&tclass2=000001007253&tclass3=000001007281&tclass4=000001007282&stat_infid=0000000370C7&result_page=1&tclass5val=0 # as "a00411.xls" GunmaPop2005 <- data.frame( Males=c(8872, 9144, 9528, 9812, 9817, 10049, 10234, 10047, 10222, 10187, 10319, 10420, 10135, 10473, 10219, 10492, 10943, 11243, 10579, 9653, 9941, 10252, 10396, 10649, 11343, 12031, 12420, 13015, 13354, 14132, 14624, 15873, 16013, 15809, 15338, 14876, 14568, 14536, 14580, 10713, 13844, 12911, 12303, 12158, 12086, 12117, 12620, 12331, 12376, 13138, 14144, 13553, 14353, 15194, 16064, 17286, 18561, 18347, 18230, 12001, 11938, 14363, 13684, 14122, 13475, 12241, 10279, 10866, 10939, 10853, 10093, 9996, 9575, 9334, 9147, 8643, 8249, 7760, 7353, 6812, 6170, 5041, 4099, 3206, 2711, 2778, 2113, 1895, 1630, 1431, 1146, 966, 675, 559, 384, 263, 212, 133, 84, 38, 24, 15, 11, 6, 1, 2, 1, 0, 0), Females=c(8323, 8750, 8964, 9359, 9559, 9605, 9511, 9800, 9790, 9848, 9939, 9755, 9696, 9884, 9734, 9767, 10293, 10616, 10040, 9383, 9731, 9748, 10211, 10204, 10500, 11086, 11758, 12248, 12548, 13524, 13907, 14930, 15129, 15057, 14344, 13982, 13942, 13587, 13972, 10359, 13212, 12435, 11934, 11673, 11668, 11583, 12100, 11867, 11917, 12746, 13364, 13170, 13968, 15318, 16251, 17125, 18253, 18042, 17927, 11981, 11773, 14450, 14124, 14438, 13502, 12960, 10729, 11710, 11697, 11884, 11413, 11442, 11087, 11035, 11209, 10646, 10482, 9784, 9777, 9491, 8891, 8188, 7636, 7034, 6123, 6103, 4577, 4415, 3861, 3426, 3035, 2571, 2064, 1683, 1209, 878, 739, 536, 333, 193, 134, 86, 56, 28, 13, 8, 5, 3, 1), Ages=0:108) pyramid(GunmaPop2005, Llab="Males", Rlab="Females", Clab="", Laxis=seq(0, 20000, len=5), Cstep=10, main="Population pyramid of Gunma Prefecture\n (Data: Census 2005, total by gender)") } \keyword{hplot} - ●以上のファイル群ができたらチェックしてからビルドする。pdflatexやGNUの各種開発ツールが必要だが,Rtoolsにまとまっているようである。2010年1月5日現在,Rtools210.exeをダウンロードしてインストールすれば,gccコンパイラを含むMinGWやPerlやlibpngや各種DLLなどが利用可能になるようである(2011年12月28日追記:2011年12月28日現在はRtools215.exe)。加えて,一応Microsoft HTML Help Workshopもインストールしておいた。しかし,pdfLaTeXに関しては当該ページにMikTeXへのリンクがあるが,普通にWin32版のpLaTeXをインストールしてパスが通った環境になっていれば(日本語の情報としては奥村さんのTeX Wikiが充実している),それでも大丈夫なようである。以前はMinGWのMsysという名前のbashからでないと操作できなかったように記憶しているが,2010年1月5日現在,Windows XPの場合だと,普通のコマンドプロンプトから操作可能である。(注)2022年2月現在、RtoolsはCRAN本体に含まれているし、ビルドもRStudioからする方が良い。
- ●具体的には,d:\work\pyramidに上記ファイル群を作ってある場合,d:\workをカレントにしておき,"C:\Program Files\R\R-2.10.0\bin\Rcmd" check pyramidする。コード中,TRUEを省略形でTとか,FALSEを省略形でFとか書いているところがあるとエラーを出して止まってしまうし,\item{}{}で説明を書いていない引数があると警告が出るが,それらを直せばcheckを通すのは難しくなかった。checkの結果はd:\work\pyramid.Rcheck内にlogなどが出来上がる。
- ●チェックを通ったらビルドである。チェックの時と同様に"C:\Program Files\R\R-2.10.0\bin\Rcmd" build pyramidとすると,d:\work\pyramid_1.1.tar.gzが出来上がった。Windows用のzipは"C:\Program Files\R\R-2.10.0\bin\Rcmd" build --binary pyramidとすればd:\work\pyramid_1.1.zipができる。なお,手動で"d:\work\pyramid.Rcheck\pyramid"をzip圧縮(
+Lhaca7-Zipなどでやれば簡単だろう)したものも,ローカルでのパッケージインストールには使えたが,--binaryオプションを使う方が簡単だしサイズも小さくなったのでお薦めである(2011年12月28日追記:R-2.13.0以降は,Windows環境でのzip作成はRCMD INSTALL --build pyramidとする。RStudioならBuildメニューのBuild Binary Packageを選ぶだけである)。 - ●後はCRANに登録してもらうだけなので,トライしてみた。helpを読むと,ftp://cran.r-project.org/incoming/に(sftpでは不可だそうだ),ユーザanonymous,パスワードを自分のメールアドレスにしてログインしてアップロードしてから,cran@r-project.orgにメールで知らせると,審査した上で無問題なら晴れてCRANに登録されることになるようだ(注:後述するが2022年現在、違うやり方になっている)。そうなれば,"Packages"の"Update packages from CRAN"でバージョン管理したアップデートができるようになるので,やってみる価値はある。FFFTPにcran.r-project.orgを設定し,PASVモードで接続して/incoming/にアップロードし,次のメールをcran@r-project.orgに送ってみた。さてどうなるだろうか。
Dear Sirs,

I have uploaded the package named `pyramid' including two functions
to draw population pyramid.  It's very simple and small.
But, as far as I know, there is no such package ever, so that I submitted.
I hope that this package can pass the review process and go to main archive.
Thank you very much.

With Best Wishes,
Minato Nakazawa, Ph.D.
Associate Professor, Gunma University Graduate School of Medicine
- ●2010年1月6日の夜に,Kurt Hornikさんからの「投稿してくれてありがとう,今CRANに載ったよ」(意訳)というメールと,Uwe Liggesさん名義で自動的に生成されたものらしい,「投稿されたtar.gzからWindows用にbuildしたので24時間以内にCRANの/bin/windos/contrib/2.10/に載るよ」(意訳)というメールが相次いで届き,無事にCRANへの登録が完了した。素晴らしいことだ。
- ●ちなみに,example(pyramid)で表示される3つの人口ピラミッドの図では,図の下が妙に広く空いている。通常のグラフでは軸目盛や目盛ラベル,軸ラベルなどは描画領域外になるので,共通描画パラメータでpar()$marのデフォルト値がc(5.1, 4.1, 4.1, 2.1)と広めのボトムマージンが取られているわけだが,この人口ピラミッド描画では,人数軸の軸目盛や目盛ラベルもすべて(軸ラベルは無いが)描画領域内であるため,par()$marの値がデフォルトのままだとボトムマージンが広すぎるのだ。この問題を解決するには,関数定義内部ではparはまったく弄っていないのだから,図を描かせる前に,例えばpar(mar=c(2,4,4,2))などとやっておけばいい。その状態で描かせた2005年の群馬県の人口ピラミッドが下図のようになる。
- ●別の手としては,関数内部でxpdをTRUEにしておき(これもpar()のパラメータだが,これくらいはたぶん,関数内部で最初にop <- par(xpd=TRUE)として最後にpar(op)するという常套手段を使えば問題ないだろう),軸目盛や軸ラベルを最初に設定した架空座標系外に描かせてしまうという手もあったかもしれない。しかし"The simple is best."という観点から,現在のような仕組みにした。
- ●(2010年3月11日更新)1月末にPhilippe Guillet, MD.という方からメールをいただいて,年齢階級の文字列だけをサイズを変える手段と,人口の目盛りラベルの書式を指定する手段を提供しようと考えていたのだが,漸く実装できたので,バージョン1.2とした。前者は年齢階級文字列をプロットする際のtext()のオプションでcex=で指定すればいいので,それをpyramid()のオプションCsizeで与えることにした。デフォルトを1にしておけば,指定しない場合はこれまで通りの動作になる。後者は目盛りラベルをプロットするtext()の中で,ただpaste(数字)としていたのを,paste(formatC(数字,format=AxisFM,big.mark=AxisBM,big.interval=3))とすることで可能であった。AxisFMを"g"としておけばこれまで通りだし,"d"としてAxisBMを","にすれば3桁ごとにコンマが入った書式になるし,AxisBMはデフォルトでは""なので,AxisFMを"d"とするだけなら桁の多い数字でも浮動小数点表示ではなく普通の整数としてプロットすることができる。このオプション追加に伴って,群馬県の人口ピラミッドをプロットする例で使い方を示すようにした。
- ●(2012年3月15日更新)サイト移転に伴い,ドキュメントのURLを書き換えた他,GunmaPop2005をドキュメントのexampleからコードの方にうつしたので,pyramidパッケージをロードするだけでGunmaPop2005が使えるようになった。CRANからもinstall.packages("pyramid")でインストールできるが,pyramid_1.3.zip,またはpyramid_1.3.tar.gzとして,このサイトからダウンロードすることもできる。
- ●(2014年9月4日更新)鵯記にメモした通り,フレーム内に描画するバージョンとして関数pyramidf()を追加した。オプションとして,描画フレームの左下と右上の座標を指定するframe=が増えただけで,他はpyramid()と同じである。frame=のデフォルトはc(-1.15, 1.15, -0.05, 1.1)であり,これはデフォルトのCgap値0.3でpyramid()を実行したときの座標と同じである。バージョン1.4をインストールすれば,library(pyramid); example(pyramidf)とするだけで,2005年と2010年の群馬県の人口ピラミッドを重ね描きする実行例が表示される。CRANからもinstall.packages("pyramid")でインストールできるが,pyramid_1.4.zip,またはpyramid_1.4.tar.gzとして,このサイトからダウンロードすることもできる。
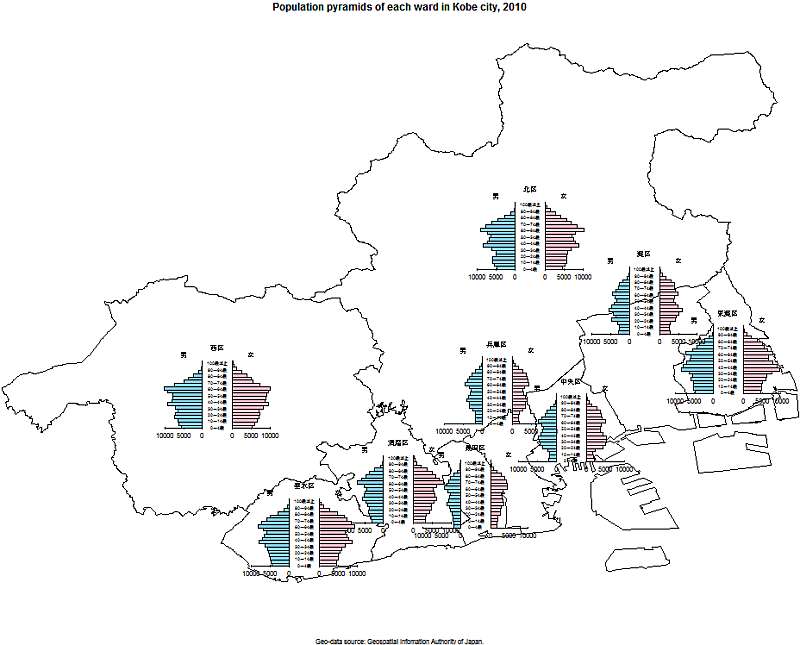
- ●(2014年9月6日追記)ついでに,神戸市の地図上に区別に人口ピラミッドを描くサンプルコードも載せておく。国土地理院のウェブサイトから兵庫県のshapeファイルを含むN03-140401_28_GML.zipをダウンロードし展開した後,EpiInfoに含まれているEpiMapのAddLayerPartial機能を使って神戸市だけの地図情報をkobe-city.shpとして保存し,同じディレクトリに神戸市の区別の人口データ(神戸市が独自に国勢調査結果をまとめているページから,平成22年国勢調査結果の「全市」をダウンロードして加工したもの)を置いて,Rでそのディレクトリを作業ディレクトリにしてこのコードを実行すると下図ができる(低解像度ラスタデータなので,国土地理院のシェイプファイル地理情報を使って描いたが個別許可は必要ないはず)。
- ●(2019年7月14日追記)鐵人三國誌にメモしたが,毎年人口学(Demography)の非常勤講義に来てくれている林さんが,今年はWorld Population Prospectsの2019年版を使って演習してくれたが,wpp2019というパッケージとして既にcranにデータがあるので,表計算ソフトで一々コピペするよりもRでコードを書いてしまった方が楽だろうと思って,コードを書いてみた。が,wpp2019には多くの国・地域別に1950年から2020年までの年齢5歳階級別人口が入っているので,国・地域と年次を複数選択して(複数選択は,Ctrlキーを押しながらマウスクリックという,EZRと同じ方法)一気に人口ピラミッドを書く方が楽だろうと思って,それができるコードも書いてみた。けれども,軸目盛の自動指定が今ひとつなので情報募集していたところ,裏RjpWikiさんにpretty()という関数をご教示いただき,試してみたらこっちの方がきれいな軸目盛になった気がした(pretty()については,ほくそ笑むさんによる素晴らしい解説記事が参考になる)。そこで,pyramid()の軸目盛のデフォルト設定を,これまでの0から最大値までを5等分するという単純な方法から,pretty()を使って設定する方法に変えた。もちろんLaxis=オプションで指定すれば,これまで通りに任意の軸目盛を与えることができるのは変わらない。pyramid_1.5.zip,またはpyramid_1.5.tar.gzとして,このサイトからダウンロードすることができるが,CRANにも登録申請した。ブラジル・中国・フランス・日本の1950年,1985年,2020年の人口ピラミッドを示しておく。
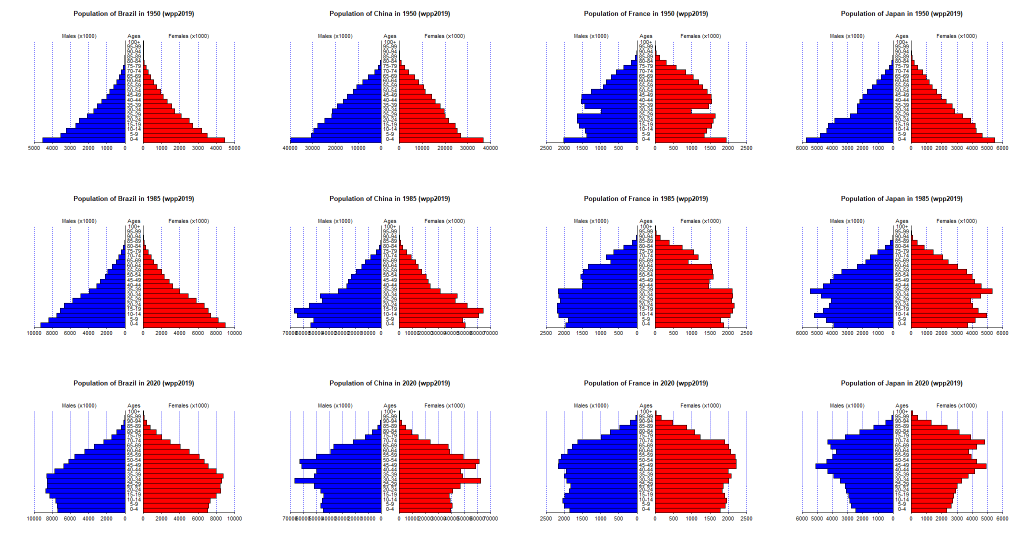
なお,1.5の登録申請後に,三重大学の奥村先生から,統計グラフの色というページを教えていただき,グラフのデフォルト描画色として,ユニバーサルデザインのベースカラーを使ったらどうかとご提案いただいた。確かにこれまで色には無頓着だったが,その方が良いと思うので,1.6で取り入れたいと思う。左が"#bfe4ff"で右が"#ffcabf"かな。試しにさっき作ったピラミッドをこの色で描き直してみると(コード,ただしサイズは後で半分に縮小した)下図のようになる。たしかにこの方が目に優しい気がする。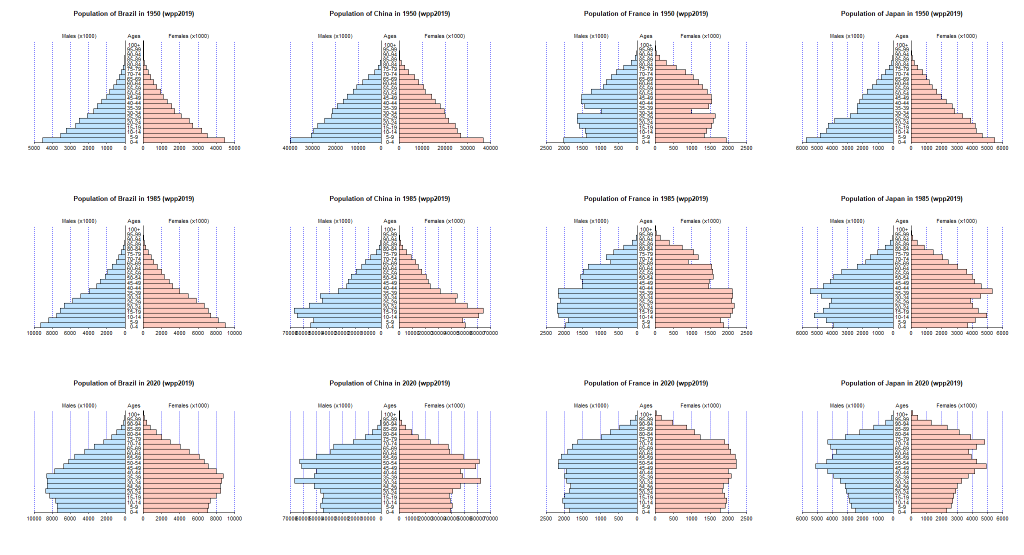
地図関連
古い情報だが、EpiInfoによる塗り分け地図は多少役に立つかも。
2022年2月現在、Rで国レベルの塗り分け地図を描くには、mapdataパッケージを使うのが一番簡単だと思う。より低レベルの地域区分データは、GADMのデータを簡単に使えるようにする、GDAMtoolsパッケージ(GitHubのページも参照)を使うと良いように思う。
Correspondence to: minatonakazawa[at]gmail.com.